Which Streaming Networks Performed Best for Travel and Leisure Advertisers?
Frankie Karrer | 6 Min Read

July 2022 was the first month Americans spent more of their TV time with streaming than with cable, according to Nielsen’s The Gauge. It was also the middle of summer travel season, which made it a useful month for a narrow question: when travel and leisure brands advertised on Connected TV (CTV), which streaming networks were their ads running on when viewers went on to convert?
That summer was an unusual one for travel. After two years of pandemic disruption, people were flying again in numbers close to normal. The TSA screened more than 11.3 million travelers over the Fourth of July weekend, 93% of its 2019 volume for the same holiday period. And those travelers were paying more to do it. Consumer prices rose 9.1% in the 12 months ending in June 2022 (the largest jump in more than 40 years), and airline fares rose 34.1%, according to the Bureau of Labor Statistics.
Some of that tension has returned. The U.S. Travel Association’s fall 2026 forecast projects that travel prices will rise 7.2% this year, more than twice the rate of overall inflation, even as Americans take a record number of domestic trips. Streaming has kept growing too, reaching a record 49.6% of all TV viewing in August 2026. With travel demand holding up and prices climbing again, how travel shoppers responded to ads and the networks they were watching in the summer of 2022 may offer some clues about how they’ll respond in the years ahead.
How the data was gathered
This analysis comes from a MNTN study of travel and leisure campaigns that ran on MNTN’s CTV advertising platform in July 2022. The campaigns were bought programmatically and targeted by audience. The system decided which households to reach and bid on available inventory based on each advertiser’s goal, such as a target cost per acquisition (CPA) or return on ad spend (ROAS). Where an ad ran was a result of where those households happened to be watching. These results come from one platform in one month and show correlation, and a strong network may simply be where the system found its target households and kept buying.
Local news ranked highest on conversion rate
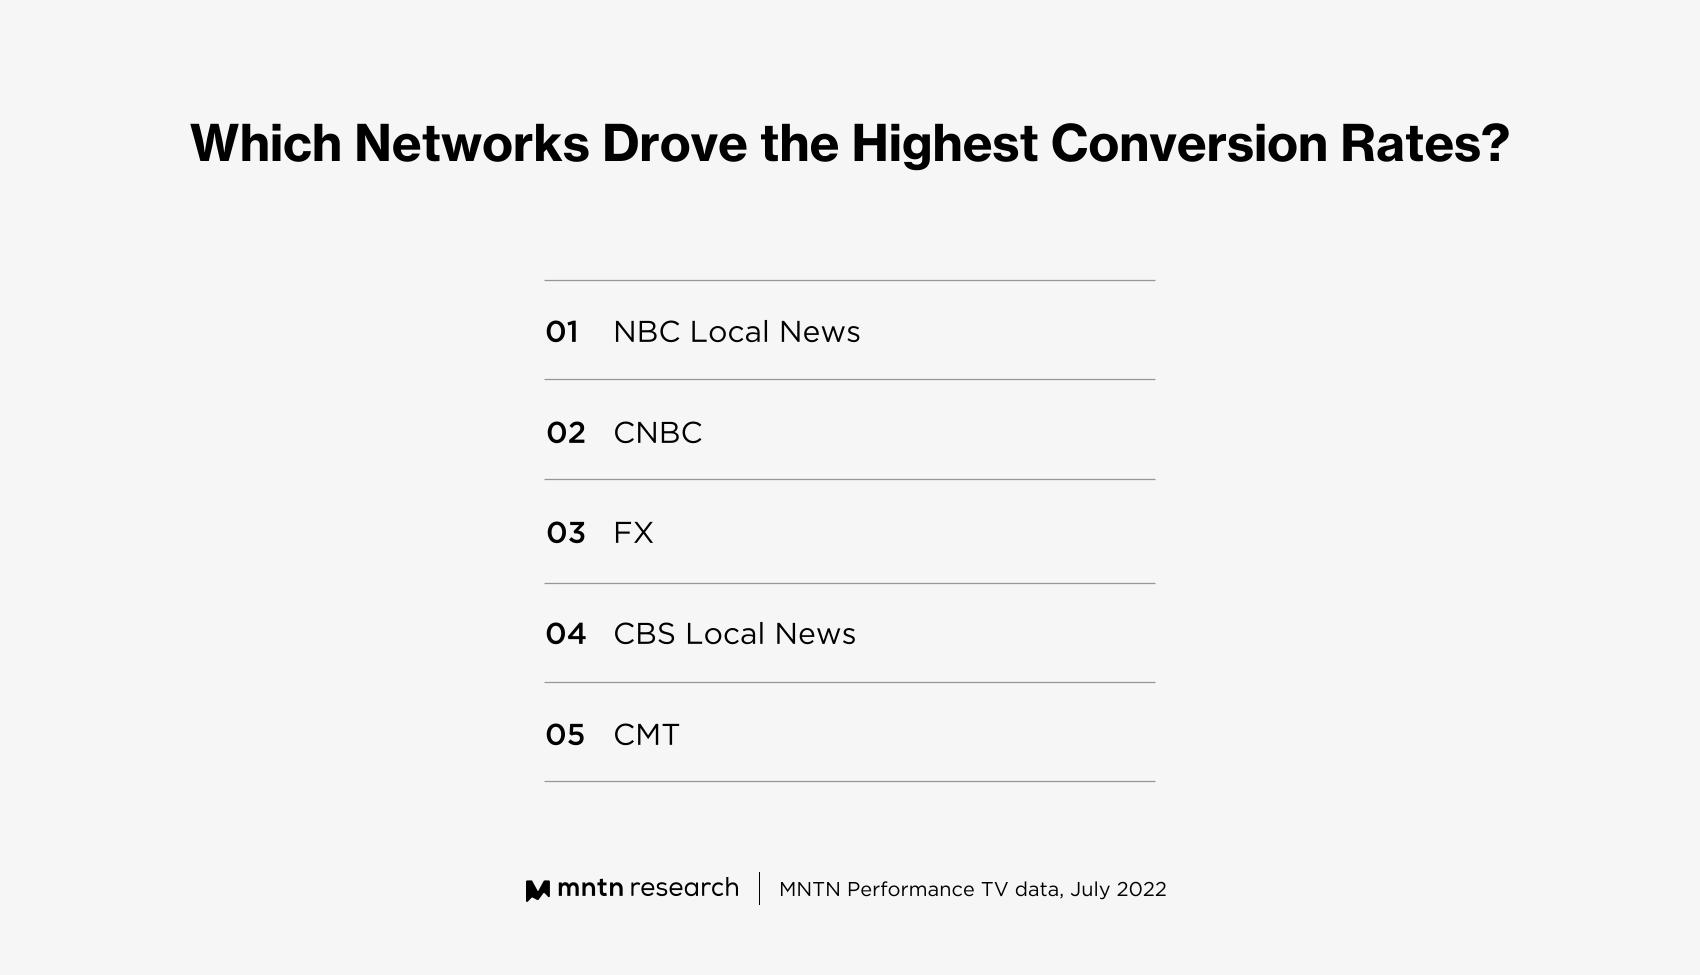
News isn’t necessarily a genre most people associate with travel, but three of the networks with the highest conversion rates were news channels. Local news did especially well, with NBC Local News ranking first and CBS Local News ranking fourth.
Many people still tie local news to traditional linear TV, but broadcasters have been expanding into streaming for years. CBS, for one, now runs 24/7 local news streams in over 10 markets. The viewers in this data were watching local news over streaming, and they converted on travel ads at some of the highest rates of any network audience.
Why they converted at such high rates is harder to pin down, but one possibility is routine. Local news is where many people check the weather and traffic, and two-thirds or more of U.S. adults at least sometimes get local news on those topics, according to Pew Research Center. Viewers who tune in regularly are likely to see the same advertisers more than once.
FX had the lowest CPA
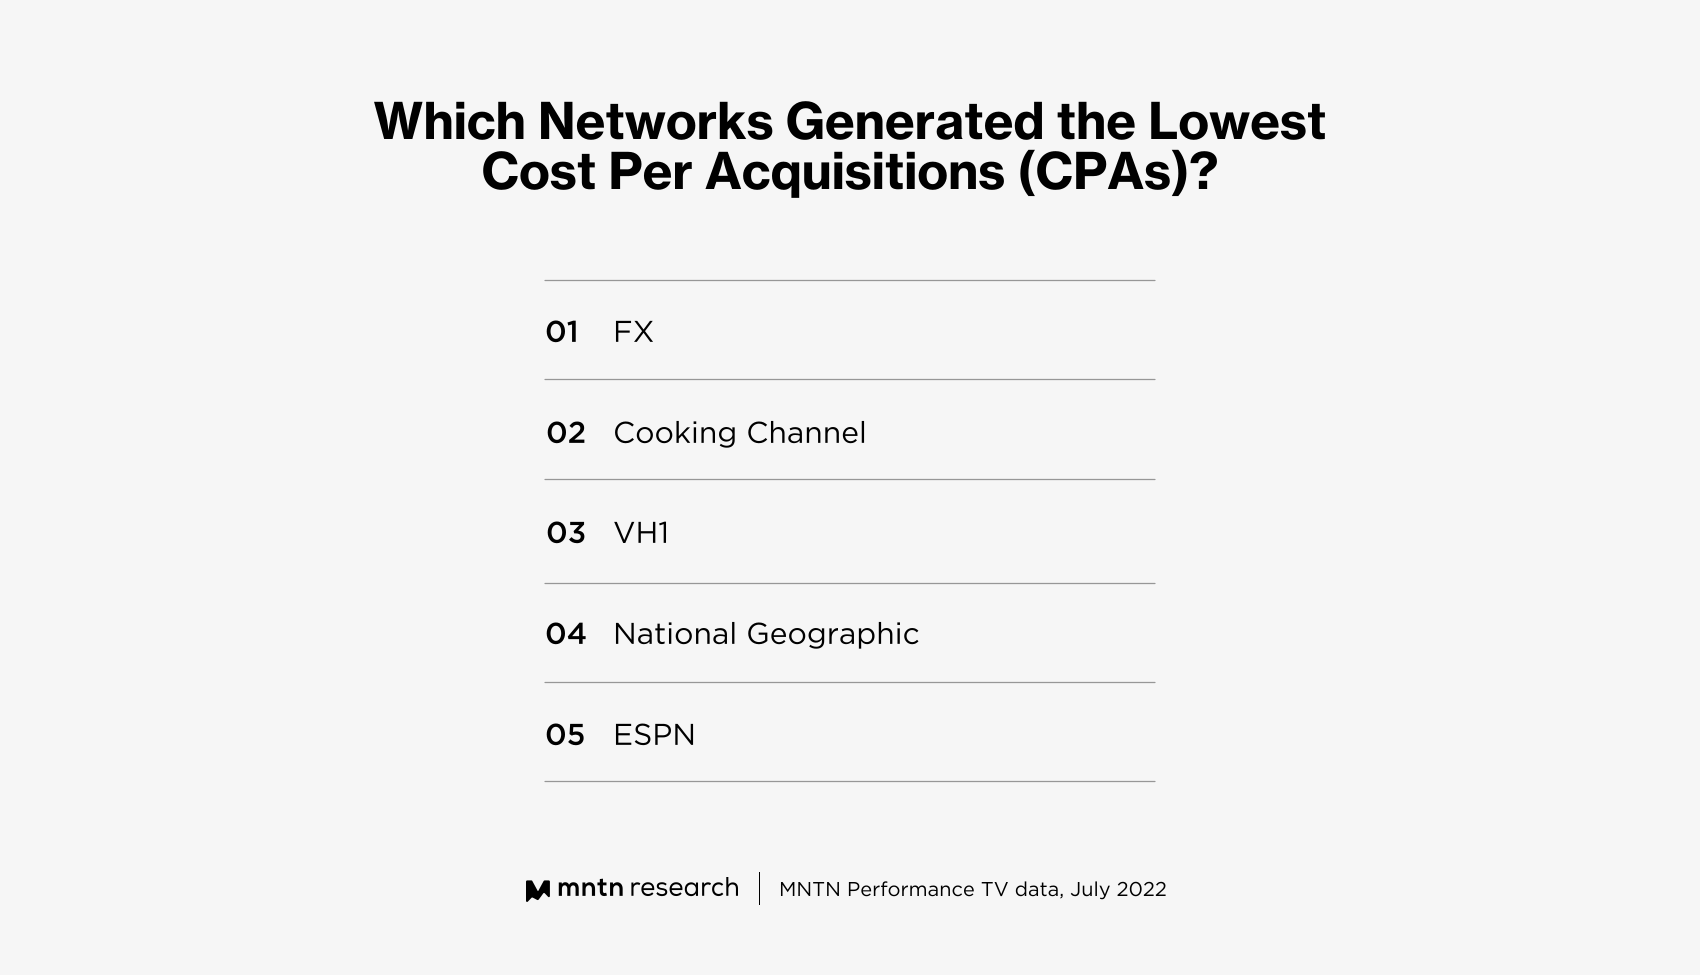
FX, home to shows like It’s Always Sunny in Philadelphia and Adults, had the lowest CPA of any network in the data set. Its programming has no obvious connection to travel, and the same is true of other networks on the list, such as VH1 and ESPN. Networks with a clearer travel link appeared too: Cooking Channel and National Geographic both posted low CPAs.
The mix suggests that travel and leisure customers weren’t clustered around travel programming. They were spread across sports, entertainment, and lifestyle networks, which is a pattern you would expect if an interest in travel belongs to the viewer and follows them wherever they watch. For a brand that buys by network, that’s a case for looking past travel-themed channels.
High ROAS and high conversion rates often didn’t overlap
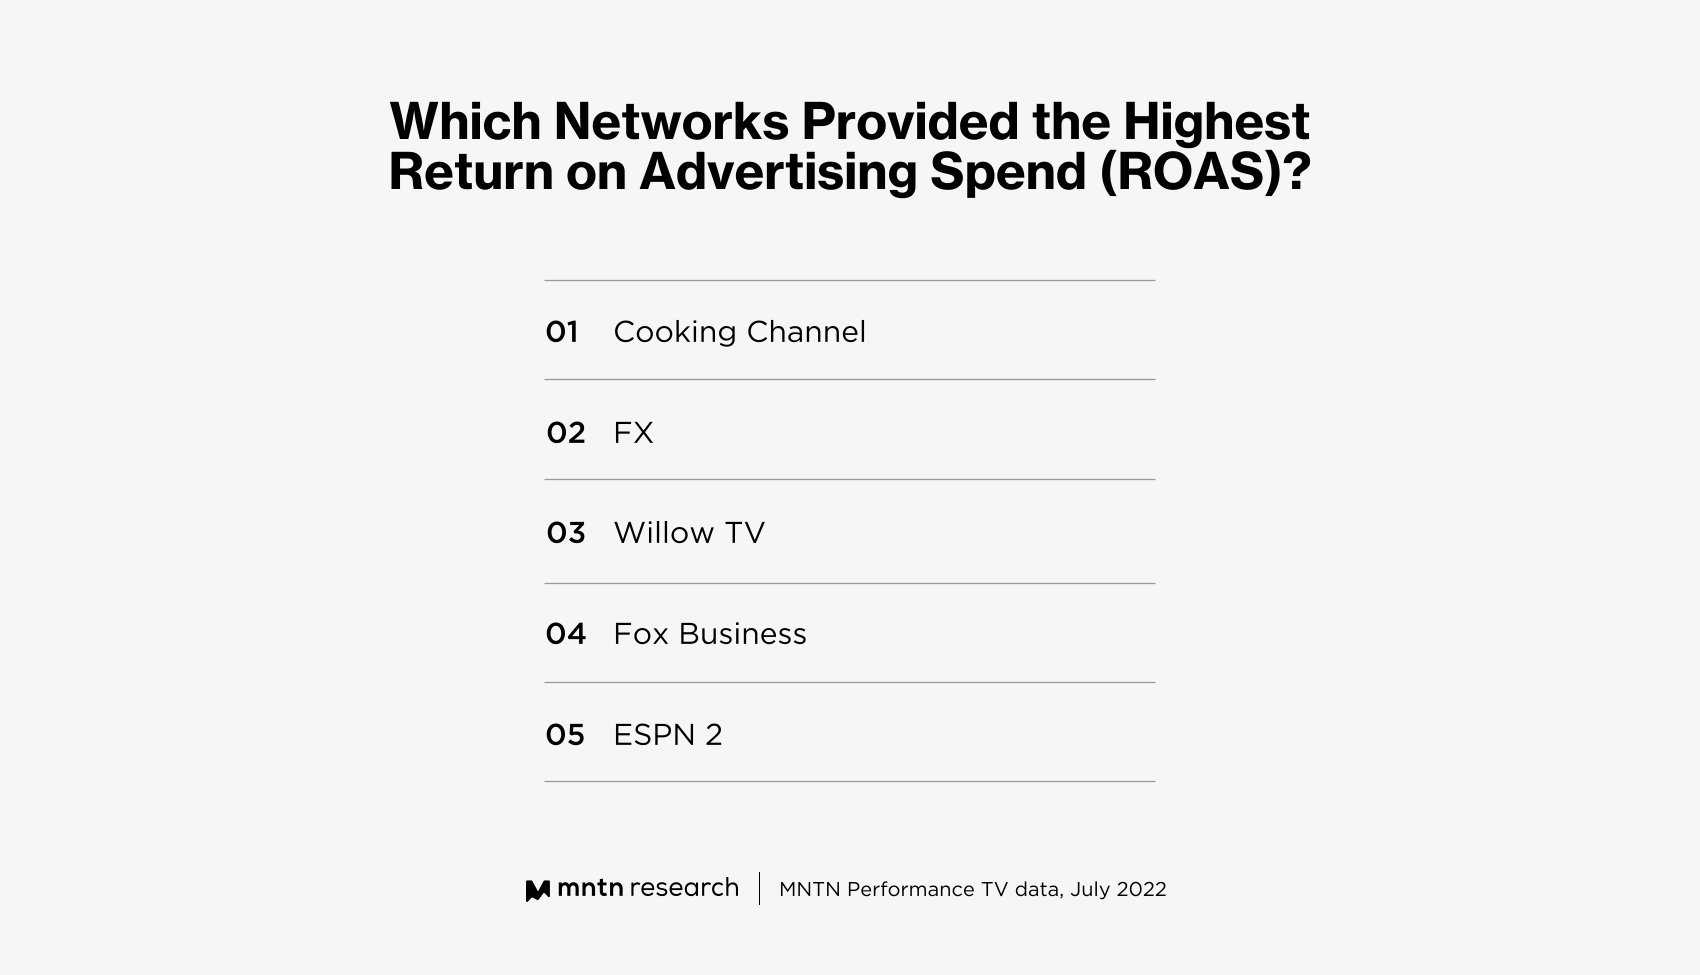
FX ranked high on both ROAS and conversion rate, but most of the other high-ROAS networks did not. The last three on the chart, Willow TV, Fox Business, and ESPN2, had conversion rates well below average. The three networks just below them in ROAS, National Geographic, ESPN, and VH1, were more balanced. Each posted an above-average conversion rate, a low CPA, and a high impression count.
A split between these two metrics isn’t surprising. ROAS reflects how much revenue the conversions brought in, so a network that delivered a handful of expensive bookings, like a cruise or resort stay, can post strong ROAS on a low conversion rate. Network size matters as well. Willow TV is a cricket network with a small, specialized audience, and on a base that small, a few large purchases can push ROAS a long way.
Which metric deserves more weight depends on the business, so it helps to know where yours falls on that trade-off. Do you sell high-ticket trips, where a low conversion rate is fine as long as each booking is large? Or do you need steady volume, like a regional attraction or a hotel group filling weeknight rooms, where conversion rate and CPA matter more?
Other findings
FX ranked near the top on every measure. Along with its conversion rate, CPA, and ROAS, FX had impression and total conversion counts well above average for travel and leisure campaigns. Some of that is likely a matter of scale. A large network gives the system more inventory to buy, and once a network starts performing, the system tends to buy more of it, raising both impressions and conversions.
Travel-themed networks did well without leading. Travel Channel, the network most obviously linked to travel, beat the average on conversion rate, CPA, and ROAS but didn’t rank near the top on any of them. Hallmark, HGTV, and TLC followed a similar pattern.
High impression counts didn’t guarantee high conversion rates. Several networks delivered large numbers of impressions with below-average conversion rates, including Investigation Discovery, OWN, The CW, and WeatherNation.
A familiar forecast
Summer 2022 was something of a stress test for travel marketing. Demand came back quickly, prices rose with it, and travel ads performed best on local news, FX, and sports networks, while the channels built around travel finished above average but short of the top. With travel prices projected to outpace overall inflation again in 2026, brands may be heading into a similar stretch of strong demand and higher costs. If they are, the travelers a brand needs may again be watching well outside travel programming.