10 Best OTT Platforms & Streaming Services in 2026
The MNTN Team | 11 Min Read
Quick Takeaways
What marketers should know about today’s OTT and streaming landscape.
-
Streaming dominates TV viewing, making Connected TV essential to the media mix.
-
Ad-supported subscriptions grew fastest, while rentals and purchases declined.
-
Netflix leads on scale, but platform choice depends on audience fit and access.
-
Live sports, bundles, and premium programming differentiate streaming services.
-
OTT gives marketers precise targeting, measurable performance, and accountability.
OTT is still the umbrella term many marketers use, but in 2026, the bigger story is how completely streaming has taken over the living room. Nielsen says audiences spent 16.7 trillion minutes streaming in 2025, up 19% year over year, and streaming captured a record 47.5% of total TV viewing in December 2025. For advertisers, that makes Connected TV advertising a lot less like an experimental budget line and a lot more like required reading.
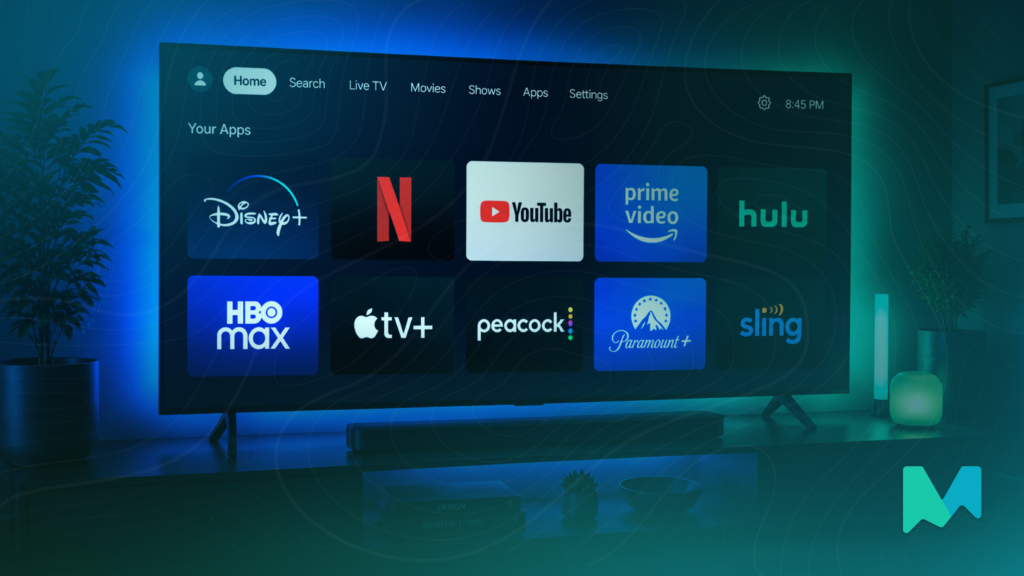
When it comes to OTT advertising, the “best” platform is not simply the one with the biggest name. The best OTT platforms have the right audience, the right ad access, and the right viewing environment for your goals. Here’s a current look at the 10 streaming services that matter most in 2026.
What Are OTT Streaming Services?
OTT streaming services deliver video content directly to viewers via the internet, bypassing traditional cable or satellite television providers. These platforms offer a variety of content, including movies, TV shows, documentaries, and live events, all of which are accessible on demand.
The primary OTT streaming service models are AVOD, SVOD, and TVOD.
Here’s a closer look at those three models and what sets them apart.
AVOD
An advertising video-on-demand (AVOD) model provides consumers with free or low-cost streaming content in exchange for watching streaming ads during their shows and movies.
SVOD
Subscription video-on-demand (SVOD) allows viewers to pay a recurring monthly fee in exchange for access to the platform’s content library. SVOD may be ad-free or ad-supported.
TVOD
Transactional video-on-demand (TVOD) relies on one-off purchases. Viewers will pay a one-time fee to purchase or rent content that isn’t available through the subscription or ad-supported library.
Now, let’s get into the best OTT platforms of 2026.
1. Netflix
Netflix is still the scale monster. The company crossed 325 million paid memberships in Q4 2025, ad revenue rose to more than $1.5 billion in 2025, and Netflix says that the ad business is expected to roughly double in 2026.
In the U.S., Standard with ads costs $8.99 per month, while Standard and Premium cost $19.99 and $26.99 per month, respectively. The bigger change, though, is strategic: Netflix is no longer the premium, ad-free holdout from streaming lore. It is now one of the biggest ad-supported stories on the market, even though some titles remain unavailable on the ad plan due to licensing.
2. Hulu
Hulu still earns its keep by doing many jobs well. It combines on-demand TV and movies, current-season programming, originals, ad-supported and ad-free plans, and Hulu + Live TV options. In Disney’s first quarter, the bigger-company story was stronger SVOD revenue and operating income — another way of saying Hulu’s value in 2026 is not just about library depth, it’s about how well Hulu fits into Disney’s broader bundle, live TV, and streaming profitability strategy.
3. Peacock
Peacock has become one of the clearest examples of how sports can turbocharge a streaming service. Comcast reported 44 million paid Peacock subscribers at the end of 2025, up 22% year over year, while Peacock revenue grew 23% in Q4 to $1.6 billion.
On the consumer side, Peacock Select is $7.99 per month, Peacock Premium is $10.99 per month, and Premium Plus is $16.99 per month. The platform continues to lean hard into live sports, news, NBC, and Bravo content, as well as familiar library viewing. If your target viewer still likes appointment television, Peacock is not exactly subtle about showing up for that job.
4. Disney+
Disney+ is still a heavyweight for family viewing, franchise fandom, and broad household reach. But the real 2026 story is less about raw subscriber bragging rights and more about strategic packaging.
Disney+ now sits at the center of a bundle ecosystem that can include Hulu, ESPN, and even HBO Max, while Disney’s first quarterly report in 2026 showed Entertainment SVOD revenue up 11% and operating income up to $450 million. For advertisers, that makes Disney+ important not just because of what’s on the service, but because of how deeply it is woven into the broader streaming bundle economy.
5. Paramount+
Paramount+ keeps winning by being more useful than flashy. Its Essential plan is ad-supported at $8.99 per month, while Premium costs $13.99 per month and adds SHOWTIME, CBS live, downloads, and mostly ad-free viewing outside live TV. More importantly, the service blends hit originals with a deep catalog and live sports like the NFL on CBS and the UEFA Champions League, which gives it a broader audience profile than marketers sometimes credit it with.
6. Prime Video
Prime Video may be the most hybrid platform on this list. It sits inside Prime, supports add-on subscriptions, carries live sports and live TV, and still lets users rent or buy titles outside the included catalog.
On the ad side, Amazon says Prime Video now has an average monthly U.S. ad-supported reach of 115 million-plus viewers, with pre-roll and mid-roll formats and “meaningfully fewer ads” than linear TV. For advertisers, that makes Prime Video less a niche streaming service and more a massive entertainment-and-commerce environment with real scale.
7. HBO Max
The platform formerly called Max is HBO Max again, which is honestly fitting, because the HBO brand still does a lot of the heavy lifting. Warner Bros. Discovery finished 2025 with nearly 132 million streaming subscribers and expects to surpass 150 million by the end of 2026.
In the U.S., plans currently start at $10.99 per month for Basic with Ads, $18.49 per month for Standard, and $22.99 per month for Premium. For advertisers, HBO Max remains especially valuable when prestige programming, a strong environment, and high-attention households matter.
8. YouTube TV
YouTube TV is not an AVOD platform. It is a paid live TV streaming service. It’s basically a virtual cable bundle with 100+ channels, local coverage in over 98% of U.S. TV households, unlimited DVR, and household account sharing. That makes it especially relevant for sports, news, and live-event viewers who still want a channel guide, just without the cable box and the annual-contract energy.
9. Apple TV
Apple TV still plays a different game than almost everyone else here. It remains mostly an all-original, commercial-free subscription service, now priced at $12.99 per month after a seven-day trial, and Apple emphasizes hundreds of exclusive shows and movies with new releases weekly. It has widened its appeal with sports like MLS, Formula 1, and Friday Night Baseball, but from an advertising perspective, its role is more contextual than inventory-based: it is a premium viewer destination, not a mainstream ad-supported buy.
10. Sling TV
Sling TV is still the scrappy cord-cutter option, but the 2026 version of Sling is more flexible than the old orange-versus-blue caricature suggests. Sling describes itself as a live TV streaming service without rigid contracts, and it now pairs paid packages with Freestream, its free ad-supported offering, which includes 600+ free channels. For price-sensitive households and live-TV loyalists, that makes Sling one of the clearest bridges between traditional channel bundles and the newer FAST universe.
How OTT Streaming Platforms Benefit Advertisers
OTT streaming platforms aren’t just convenient for consumers. They also provide some huge benefits to advertisers. Under traditional television advertising models like linear TV, you’d have to target an entire Media Market. That means your content would be shown to many users who have no interest in your products or services.
OTT streaming lets you connect with precise audiences aligned with your campaign goals. You can target users based on behavior, demographic data, interests, and more.
Delivering content via streaming services also makes it easier to measure the reach and impact of your campaigns. You can tell which content is performing up to expectations and which ads are falling short of your goals.
Why Marketers Need MNTN Performance TV
OTT platforms keep multiplying, but marketers do not need to chase every individual streaming service to make TV work harder. MNTN helps brands reach premium streaming audiences through high-quality CTV inventory, AI-powered audience targeting, automated optimization, and real-time reporting built for measurable performance.
Instead of treating OTT growth as a fragmented media challenge, marketers can use it as an opportunity to reach the right viewers with more precision and accountability. Turn streaming audience growth into performance you can measure—sign up today with MNTN’s self-serve software.
Best OTT Platforms & Streaming Services
The OTT platforms mentioned above are currently leading the streaming services market. They offer diverse content and innovative features that cater to a wide range of audience preferences. For advertisers and marketers, leveraging these platforms can significantly enhance your reach and impact.
MNTN Performance TV helps you do exactly that while maintaining an edge over the competition. Use MNTN and other resources to integrate these streaming platforms into your brand-building strategy.
Want a Closer Look?
Discover how Performance TV delivers revenue, conversions and more through the power of Connected TV. Request a demo today to speak to an expert.