Sep. 20269 Min. Read
How an Automotive Plant Inspired MNTN’s New Production Operations System
In 2023, our engineering team was moving fast. We were pushing hard to grow the business by shipping new features and expanding product capabilities. From the outside, things looked healthy. Internally, though, we were starting to notice a recurring issue that we needed to solve. If and when something broke, we didn’t always know right away.
The signals indicating a problem could be very subtle, like a slight drop in performance or an unexpected shift in pacing, things that may not immediately raise alarms. By the time we realized something was broken, it might have been days or even weeks since the change went into effect. And meanwhile, a bunch of other changes had already gone out too.
All of this made debugging a challenge. We had the data, but we were missing a clear way to see what had changed, and exactly when things started to deviate.
So we started looking for a better way to even approach this problem, and ended up finding inspiration in an unlikely place on the floor of an automotive assembly plant.
Inspiration from the Factory Floor
In 2024, our CEO Mark Douglas and CTO Richard Girges organized an offsite for the engineering leadership team at a major automotive manufacturing facility in the UK. We were there to learn how large-scale manufacturing systems maintain efficiency and quality.
Their automation was incredibly impressive. What really caught our eyes, though, was how much visibility employees had into everything happening across the factory floor.
Every step of the production process was being monitored. Sensors tracked what was happening at each stage, and all of that information flowed into a central control room. If something deviated from expectation, it was detected almost immediately. They didn’t have to wait for downstream symptoms to surface to know something had gone wrong. Their system was telling them, in real time, how it was behaving.
Seeing that completely changed how we thought about production operations.Up to that point, we had been treating monitoring as something layered on top of our system, when it really needed to be an intrinsic part of the system itself.
Rethinking Production Operations
When we got back, we started tossing around a simple question: how quickly would we know if something went wrong anywhere on our platform?
The honest answer at the time: Not quickly enough.
That was the spark that got us started on building something that could do far more than a collection of dashboards and alerts. We were going to treat our platform more like a production system in a manufacturing plant and monitor every step. From there, we redesigned our system to continuously evaluate itself, with every component emitting signals that could be collected, analyzed, and acted upon automatically.
Making the System Self-Check on Results
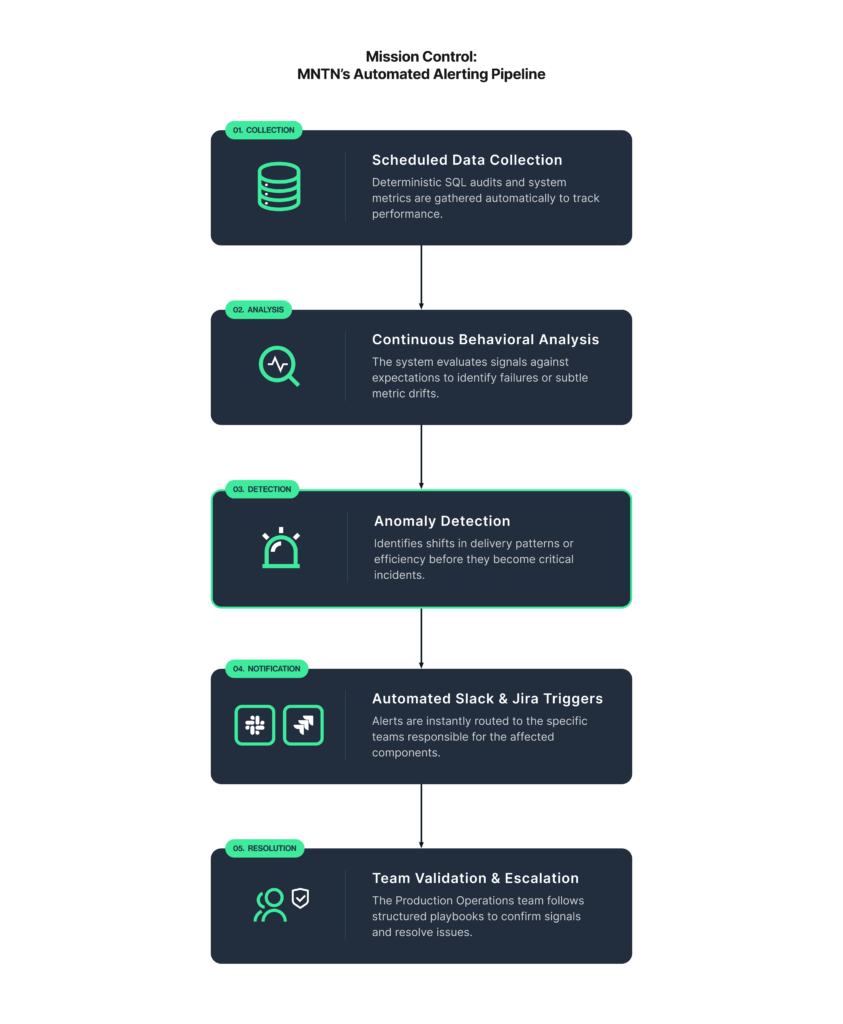
The first thing we built was what we call the audit system. These are deterministic checks (usually implemented as SQL queries) that validate whether the system is behaving exactly as expected. Each check either passes or fails, so there’s no room for misinterpretation.
This proved especially valuable after deployments. Every code or configuration change would be followed immediately by a series of validations. If something broke a core assumption, the system told us right away.
But not every problem shows up as a clear failure. Some begin as small changes that gradually become bigger ones. That led us to the next layer: monitoring.
Watching Behavior, Not Just Failures
Monitoring gave us a way to observe how the system behaves over time, but it also changed the question from “Is something broken?” to “Is something changing?”
We tracked signals like delivery patterns and cost efficiency, to look for deviations. Some changes were expected; others caught us by surprise. Over time, we learned that a lot of these incidents didn’t just suddenly appear. They developed slowly, starting as something that looked harmless one day before growing into a major headache the next day.
If we can see those changes within 24 hours, it becomes much easier for our engineers to respond before the problems begin to pile up.
Making Data Understandable
As more signals came in, we picked up on a new challenge: interpretation.
Raw data is powerful, but it’s not always intuitive. Engineers shouldn’t have to scan rows of numbers to get an idea of what’s happening, so we invested in visualization tools, like Grafana and Mode Analytics, to turn our data into something easier to parse. We used to need a team of Data Analysts to pull the numbers and build out charts for us, which could take hours at a minimum. Now it can all happen within seconds.
Here’s a good example from this April. Our Production Operations team noticed advertisers’ aggregated spend had dipped below its expected baseline during a routine daily check. At nearly the same time, another dashboard showed an unusual spike in PSA (Public Service Announcement) impression volume, which automatically triggered an abnormal trend alert.
Neither signal alone pointed directly to the underlying cause. But when viewed together, they suggested the issue was likely related to PSA serving rather than advertiser demand or campaign pacing. That gave our engineers a clear direction for investigation.
Within minutes, they’d identified what was happening: a set of missing values in the Ad Service cache after a refresh. Once those values were restored, advertisers’ spend returned to normal.
If this same issue had played out in 2024, it would likely have taken days before anyone noticed the spend decline, followed by another day or more to correlate it with PSA traffic and figure out what was actually going wrong. With those production signals easier to see and connect, that same investigation can now happen in a fraction of the time.
We were able to respond to the incident faster and gain a deeper understanding of what the platform was trying to tell us.
From Signals to Action
The data was flowing and the insights were forming, but the process still depended too heavily on a human noticing when things looked off. As any engineer knows, that’s not something you can really scale.
But we really needed it to scale. So we connected everything into an automated pipeline, collecting data on a schedule and continuously analyzing and evaluating it against expectations. If something looks abnormal, the system doesn’t wait for a human to say, “Yes, that looks abnormal.” It triggers alerts on its own and gets it in front of the teams that need to see it, whether that’s through a Slack message or a newly created Jira ticket.
I’d say this was a big turning point for us. Instead of needing one of us to notice a problem, the system could now bring it to our attention almost immediately.
Creating a Shared View: Mission Control
With the new system and signals in place, our next step was to get our teams aligned around it.
One way we did that was to kick off a meeting we call Mission Control. Every day, our engineers convene to review anomalies, go over trends, and share context around recent changes. Over time, quietly this became one of the most valuable parts of the new process we put in place. It gives us a dedicated time to really dig into the data and triage small issues before they become bigger ones. Most importantly, it keeps everyone clear-eyed on how the system is operating and gives us a shared understanding of what we’re seeing.
Responding with Confidence
Detecting the problem is one half of the solution. The other is how quickly and effectively we respond to it.
We formalized our incident handling process into a structured playbook. When an alert is triggered, the Production Operations team follows a clear sequence: validate the signal, confirm whether it’s real, and escalate appropriately.
Because the steps are defined in advance, time isn’t wasted figuring out what to do first. All of our energy can be spent on just fixing the problem. This has been key to making incident response faster and more reliable across teams.
What Changed
It’s been over a year since we put this system in place, and it’s now hard to imagine what our work lives were like before it. Sure, we still run into unexpected issues; that’s what comes with building complex systems. It’s just that now we know those issues won’t fly under our radar.
Today, when something breaks, we usually catch it within hours, or at most a day, which is a pretty big improvement from the 3 to 7 days it used to take to uncover these issues. The early awareness limits the impact when an issue occurs and makes it easier for us to identify the root cause. All that saved time can go back to our teams so they can spend it doing what they love: shipping the incredible features we have on our roadmap.
The knock-on effect of this new process is that it’s changed the way our teams operate. Engineers can move quickly and with confidence because they know the system has their back.
A Different Way to Think About Operations
There’s certainly a technical element to the upgrades we’ve made to our process. We’ve redesigned the system to continuously emit signals about its own behavior that can be automatically evaluated. And when changes occur, it will tell us about them.
But arguably the biggest shift was conceptual. We completely changed how we think about operations from a reactive mindset to a proactive one.
As AI continues to reshape how engineers work, we see an opportunity to make Production Operations even smarter. By combining data, automation, and AI, we can reduce repetitive work, accelerate root cause analysis, and move from simply detecting issues to understanding them and eventually preventing them.
We’re not saying our systems are now incident-free, but they’re no longer catching us by surprise, thanks to the Operational Intelligence we’ve put in place: an always-on system that continuously observes, understands, and helps engineers move faster, and operate with way more confidence.